Kubernetes · kubegap
Why did the kubelet evict pods for ephemeral-storage while 15 GiB were free?
Because of evictionMinimumReclaim. Once free space crosses the kubelet's 5 % threshold, eviction continues until free space is above threshold plus minimum reclaim; k3s sets that to 10 %, so on a 106.7 GiB disk the kubelet kept evicting until 16.0 GiB were free. Thirteen of the sixteen eviction messages on 2026-11-08 show 5.9 to 15.4 GiB available. With no ephemeral-storage requests anywhere, the kubelet ranked pods by what they held on disk, and the CI runner's builds and a 4.5 GiB image, the real consumers, were not things pod eviction could free.
What it looked like
On 2026-11-08 the kubelet on one of our two nodes evicted 16 pods for ephemeral-storage, 14 production workloads and two cluster components, in three waves between 13:46 and 16:14 UTC. Only three of the sixteen eviction messages show free space under the kubelet's threshold. The other thirteen say 5.9 to 15.4 GiB were free, and nine of those say 12 GiB or more. None of the 136 containers the audit counted on the cluster had asked for any disk, so the kubelet had little to rank them by except priority and how much each one held on disk at that moment.
This is a two-node k3s cluster that I run alone for a few side projects. Times are UTC. Object names below are role names, not the real ones.
Three days later the failed pods were still there. The control plane garbage-collects terminated pods only past a threshold of 12,500, so on a small cluster they stay until something else deletes them:
$ kubectl get pods -A --field-selector=status.phase=Failed
NAMESPACE   NAME                        READY   STATUS    RESTARTS   AGE
prod-a      turn-server-…-k2m9q         0/1     Evicted   0          236d
prod-a      signaling-…-r7t4c           0/1     Evicted   0          3d
prod-b      api-server-…-p3w8d          0/1     Evicted   0          28d
prod-b      api-server-…-z6h2n          0/1     Evicted   0          28d
prod-b      api-server-…-b9v5f          0/1     Evicted   0          9d
prod-b      api-server-…-j4c7s          0/1     Evicted   0          3d
…                                       (23 Failed; the 16 Evicted all on the same node)
Thirteen of the sixteen messages had the same shape; the other three stop after the available value:
The node was low on resource: ephemeral-storage.
Threshold quantity: 5729877282, available: 15662516Ki.
Container app was using 17556Ki, request is 0, has larger consumption of ephemeral-storage.
The threshold is 5,729,877,282 bytes, 5.34 GiB. The node had 15,662,516 KiB available, 14.9 GiB. The container being evicted held 17 MiB. That is the message on a pod evicted at 14:03; the seven pods evicted between 16:13:49 and 16:14:16 carry "available" values between 12.1 and 15.4 GiB.
The previous two write-ups in this series start from the same afternoon: the 4.5 GiB image that filled the disk and the signaling server that could not come back because its image had been garbage-collected, then the TURN server that had been crash-looping since September. This one is about the evictions themselves.
The three waves
I had the one-minute free-space series from Prometheus and the eviction time of each pod from its last status condition. Put together:
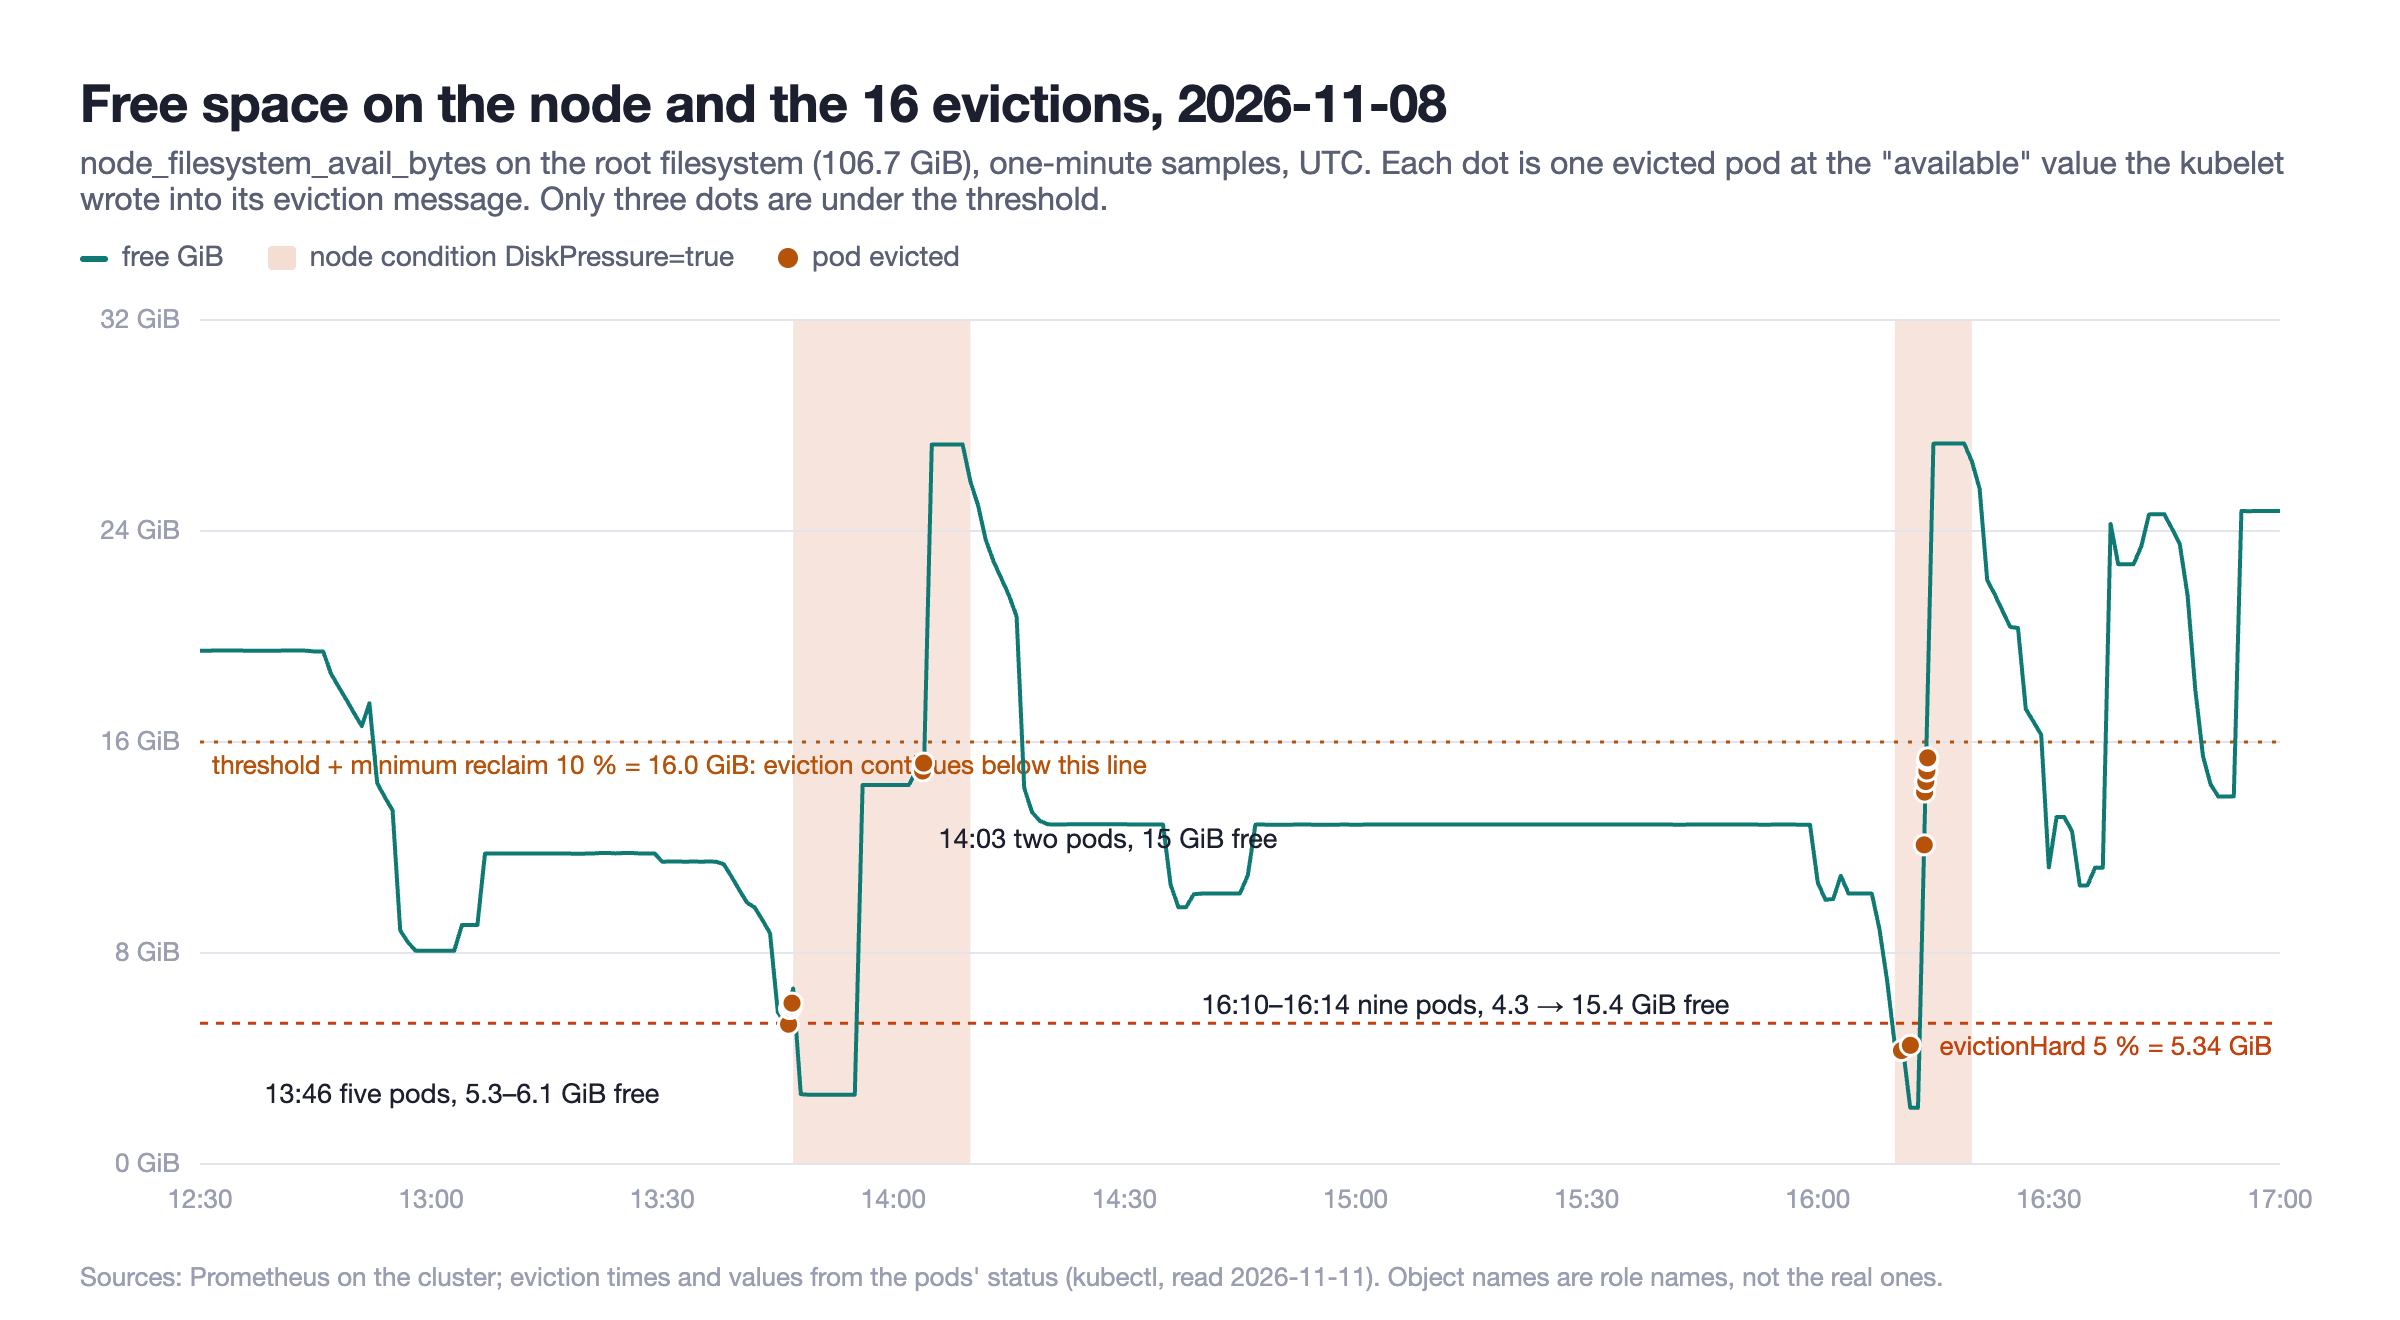
| Wave | Pods | Free space in the messages | One-minute series |
|---|---|---|---|
| 13:46:24–13:46:51 | 5 | 5.3, 5.9, 5.9, 6.0, 6.1 GiB | 5.3 GiB at 13:46, 2.6 GiB from 13:48; DiskPressure set at 13:47 |
| 14:03:48–14:03:56 | 2 | 14.9, 15.2 GiB | 14.4 GiB since 13:56; 15.3 at 14:04, 27.3 at 14:05 |
| 16:10:52–16:14:16 | 9 | 4.3, 4.5, then 12.1 → 15.4 GiB | 4.5 GiB at 16:10, 2.1 at 16:12–16:13, 14.5 at 16:14, 27.3 at 16:15 |
Only the first pod of the first wave and the first two of the third were evicted with free space under the threshold.
Why thirteen pods were evicted above the threshold
The node's kubelet configuration:
evictionHard:           imagefs.available: 5%, nodefs.available: 5%
evictionMinimumReclaim: imagefs.available: 10%, nodefs.available: 10%
evictionSoft:           none
evictionMinimumReclaim is the setting I had never looked at. Once a hard threshold has been crossed, the kubelet does not stop evicting as soon as the signal is back above the threshold. It keeps evicting, one pod per loop, until the signal is above the threshold plus the minimum reclaim, both measured as a share of the filesystem. On a 106.7 GiB filesystem that is 5.34 GiB plus 10.67 GiB: eviction continues until 16.0 GiB are free.
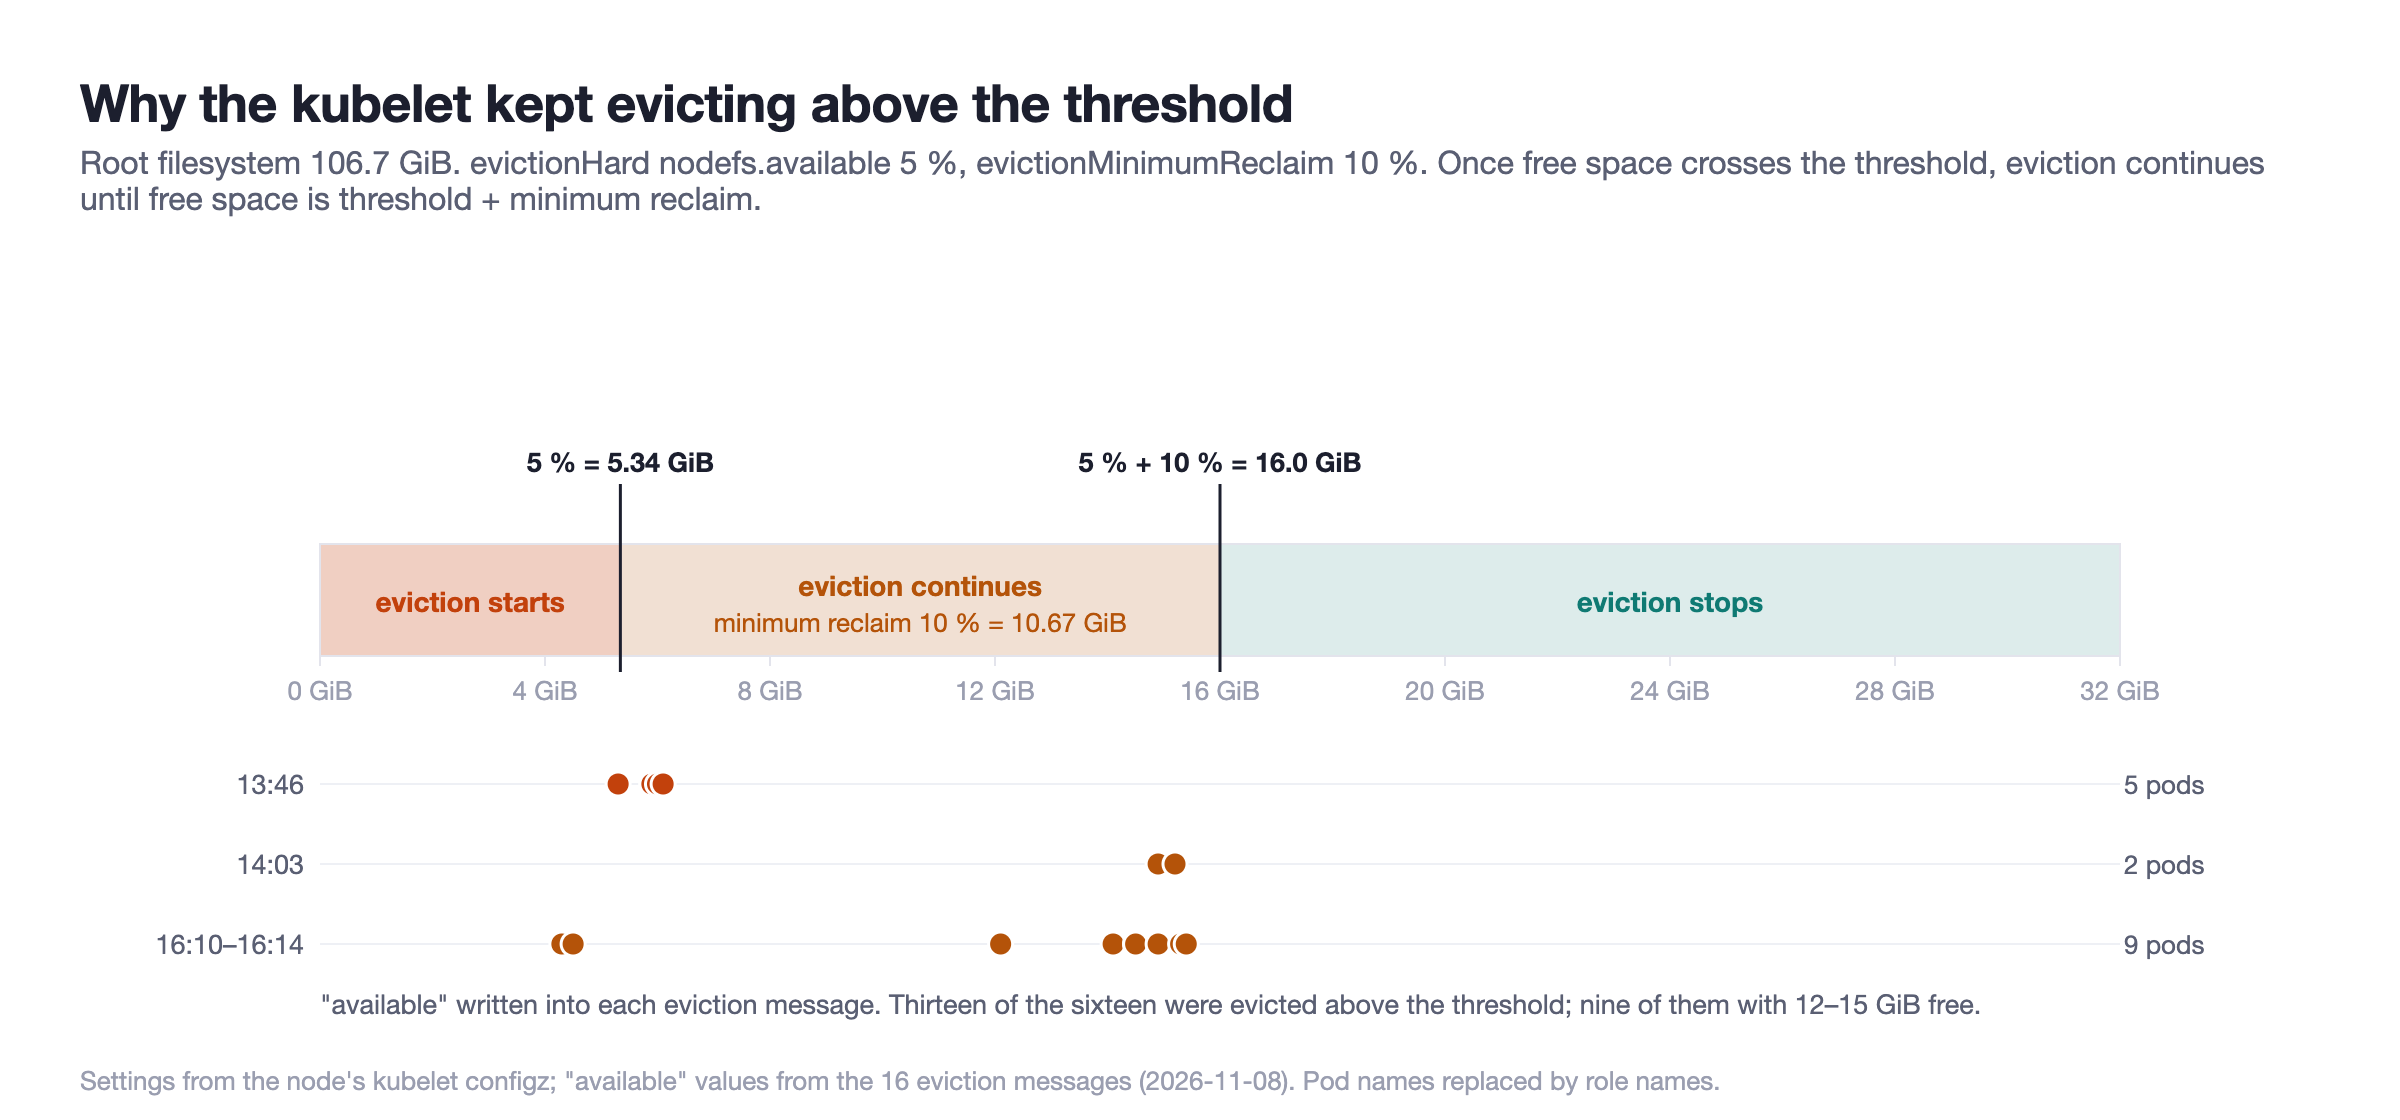
Both later waves ended within a minute of free space jumping past 16.0 GiB: the last evictions are at 14:03:56 and 16:14:16, the jumps show in the 14:05 (15.3 to 27.3 GiB) and 16:15 (14.5 to 27.3 GiB) samples. The evictions themselves freed almost nothing; the thirteen messages that state a usage add up to 182 MiB. What freed 12 GiB in a minute each time is not in any record I have. The first write-up put it down to the kubelet reclaiming unused images, which is what it does before it evicts, and the shape of the series is consistent with that. The image garbage collector's own high-water mark, 85 % used, is the same 16.0 GiB on this disk. After 14:05 the threshold was cleared, and from 14:20 the node sat at 12.9 GiB, above 5.34 and below 16.0, with no evictions until the second dip.
The upstream default for evictionMinimumReclaim is empty, which means "stop at the threshold". k3s sets 5 % thresholds and a 10 % minimum reclaim in its agent defaults, and this node runs them unchanged; I had not set either. On a node where the image store and the root filesystem are the same disk, 10 % is 10.67 GiB, and the 42 pods on this node hold 0.2 GiB between them today, and the sixteen evicted containers held 182 MiB in total, so evicting pods was never going to reach it.
Nothing asked for disk
The last line of the thirteen messages that have one ends with request is 0. The audit counted what the scheduler and the kubelet actually knew about disk on this cluster:
running containers                           136
with an ephemeral-storage request              0
with an ephemeral-storage limit                0
LimitRange objects in any namespace            0
With no requests, the scheduler places pods without looking at disk at all. When the kubelet has to pick what to evict under disk pressure it sorts pods three ways: pods whose usage exceeds their request first, then by priority, then by how far usage exceeds the request. With every request at zero, every pod holding anything on disk is in the first group, and the order inside it is priority and then whoever holds the most. One more rule sits in front of all of that: a pod the kubelet has no stats for ranks ahead of every pod it can measure. The one pod in wave 1 and the two in wave 3 whose messages carry no usage line are, I infer from the ranking code, exactly those, which is why at 16:10 and 16:12, with two runners still on the node, the signaling and TURN servers went first. The evicted containers held between 0.7 MiB and 37 MiB. The things actually consuming the disk, a 4.5 GiB model image being unpacked and, later, two CI runners building at once, are not things pod eviction can free: the image is node-level storage, and the runners are the pods holding the most, which puts them first in the sort only if they are still there when the kubelet looks.
The CI runners run as a RunnerDeployment with a docker-in-docker sidecar, whose image layers go into the sidecar's writable layer and whose checkouts go into an emptyDir, both on the node's root disk. They had CPU and memory requests and limits and nothing for storage, and no node selector, so a runner lands on whichever node has room, including the one that serves production. The audit I used to find this listed the runners as the probable cause of the 11-08 dip. For the first dip the Prometheus series does not support that: no runner pod was on the node between 13:30 and 13:55, and the free-space curve follows the model image deploy described in the first write-up; that attribution is an inference from timing, not a measurement. For the second dip it points the other way: two runner pods sat on the node from 16:04 to 16:13, the only time that day two were there at once, and free space went from 10.3 GiB at 16:07 to 2.1 GiB at 16:12. What they wrote is not recorded; the runners' own records are gone with the pods.
What I could not see
- Per-container disk use on 11-08. container_fs_usage_bytes has no series on this k3s install, and the kubelet's eviction counters were reset by a node reboot two days later. The eviction messages are the only per-pod record.
- Why the kubelet waited from 13:56, when free space was back at 14.4 GiB, until 14:03 to evict the next two pods. The kubelet log on the node was not readable from my session. One consequence is measured: the replacement pods created at 13:46 did not start until 14:09, so the node admitted nothing for 23 minutes.
- What fills the disk today. The kubelet's stats summary says the root filesystem has 72.9 GiB used, of which the image store accounts for 35.0 GiB and all 42 pods' ephemeral storage for 0.2 GiB. The node image list adds up to 15.3 GiB, so about 20 GiB of the image store belongs to nothing in the image list, which I expect to be containerd snapshots and content I cannot read, and about 38 GiB more is outside kubelet accounting entirely. Breaking that down needs root on the node.
The fix
Three changes, all in git, applied by Argo CD.
The runner and its docker-in-docker sidecar now request and limit ephemeral storage. The limits mean the kubelet evicts the runner on its own once the sidecar's writable layer passes 20 GiB, the runner's passes 10 GiB, or the pod as a whole, emptyDir included, passes 30 GiB, before the node is under pressure. The request means that under pressure a runner that has grown past 5 GiB sorts ahead of pods that are a few MiB over zero:
resources:
  requests: { cpu: 500m, memory: 1Gi, ephemeral-storage: 2Gi }
  limits:   { cpu: "2",  memory: 4Gi, ephemeral-storage: 10Gi }
dockerdContainerResources:
  requests: { ephemeral-storage: 5Gi }
  limits:   { ephemeral-storage: 20Gi }
The two GPU workloads request 2 Gi each. With a 2 Gi request and a few MiB of usage they no longer exceed their request, so the kubelet sorts them after every pod that does; while everything else requests zero, they are the last to go.
And an alert that fires before the kubelet acts:
- alert: NodeRootDiskLow        # < 15 % for 10m, warning
- alert: NodeRootDiskCritical   # <  8 % for  5m, critical → the route that mentions everyone
After the sync:
$ kubectl get pods -A -o json | … ephemeral-storage requests
ci            runner-…-d8k3p   runner   2Gi / 10Gi
ci            runner-…-d8k3p   docker   5Gi / 20Gi
ci            runner-…-m2r6w   runner   2Gi / 10Gi
ci            runner-…-m2r6w   docker   5Gi / 20Gi
prod-b        embedding-…      app      2Gi / –
prod-c        ai-…             ai       2Gi / –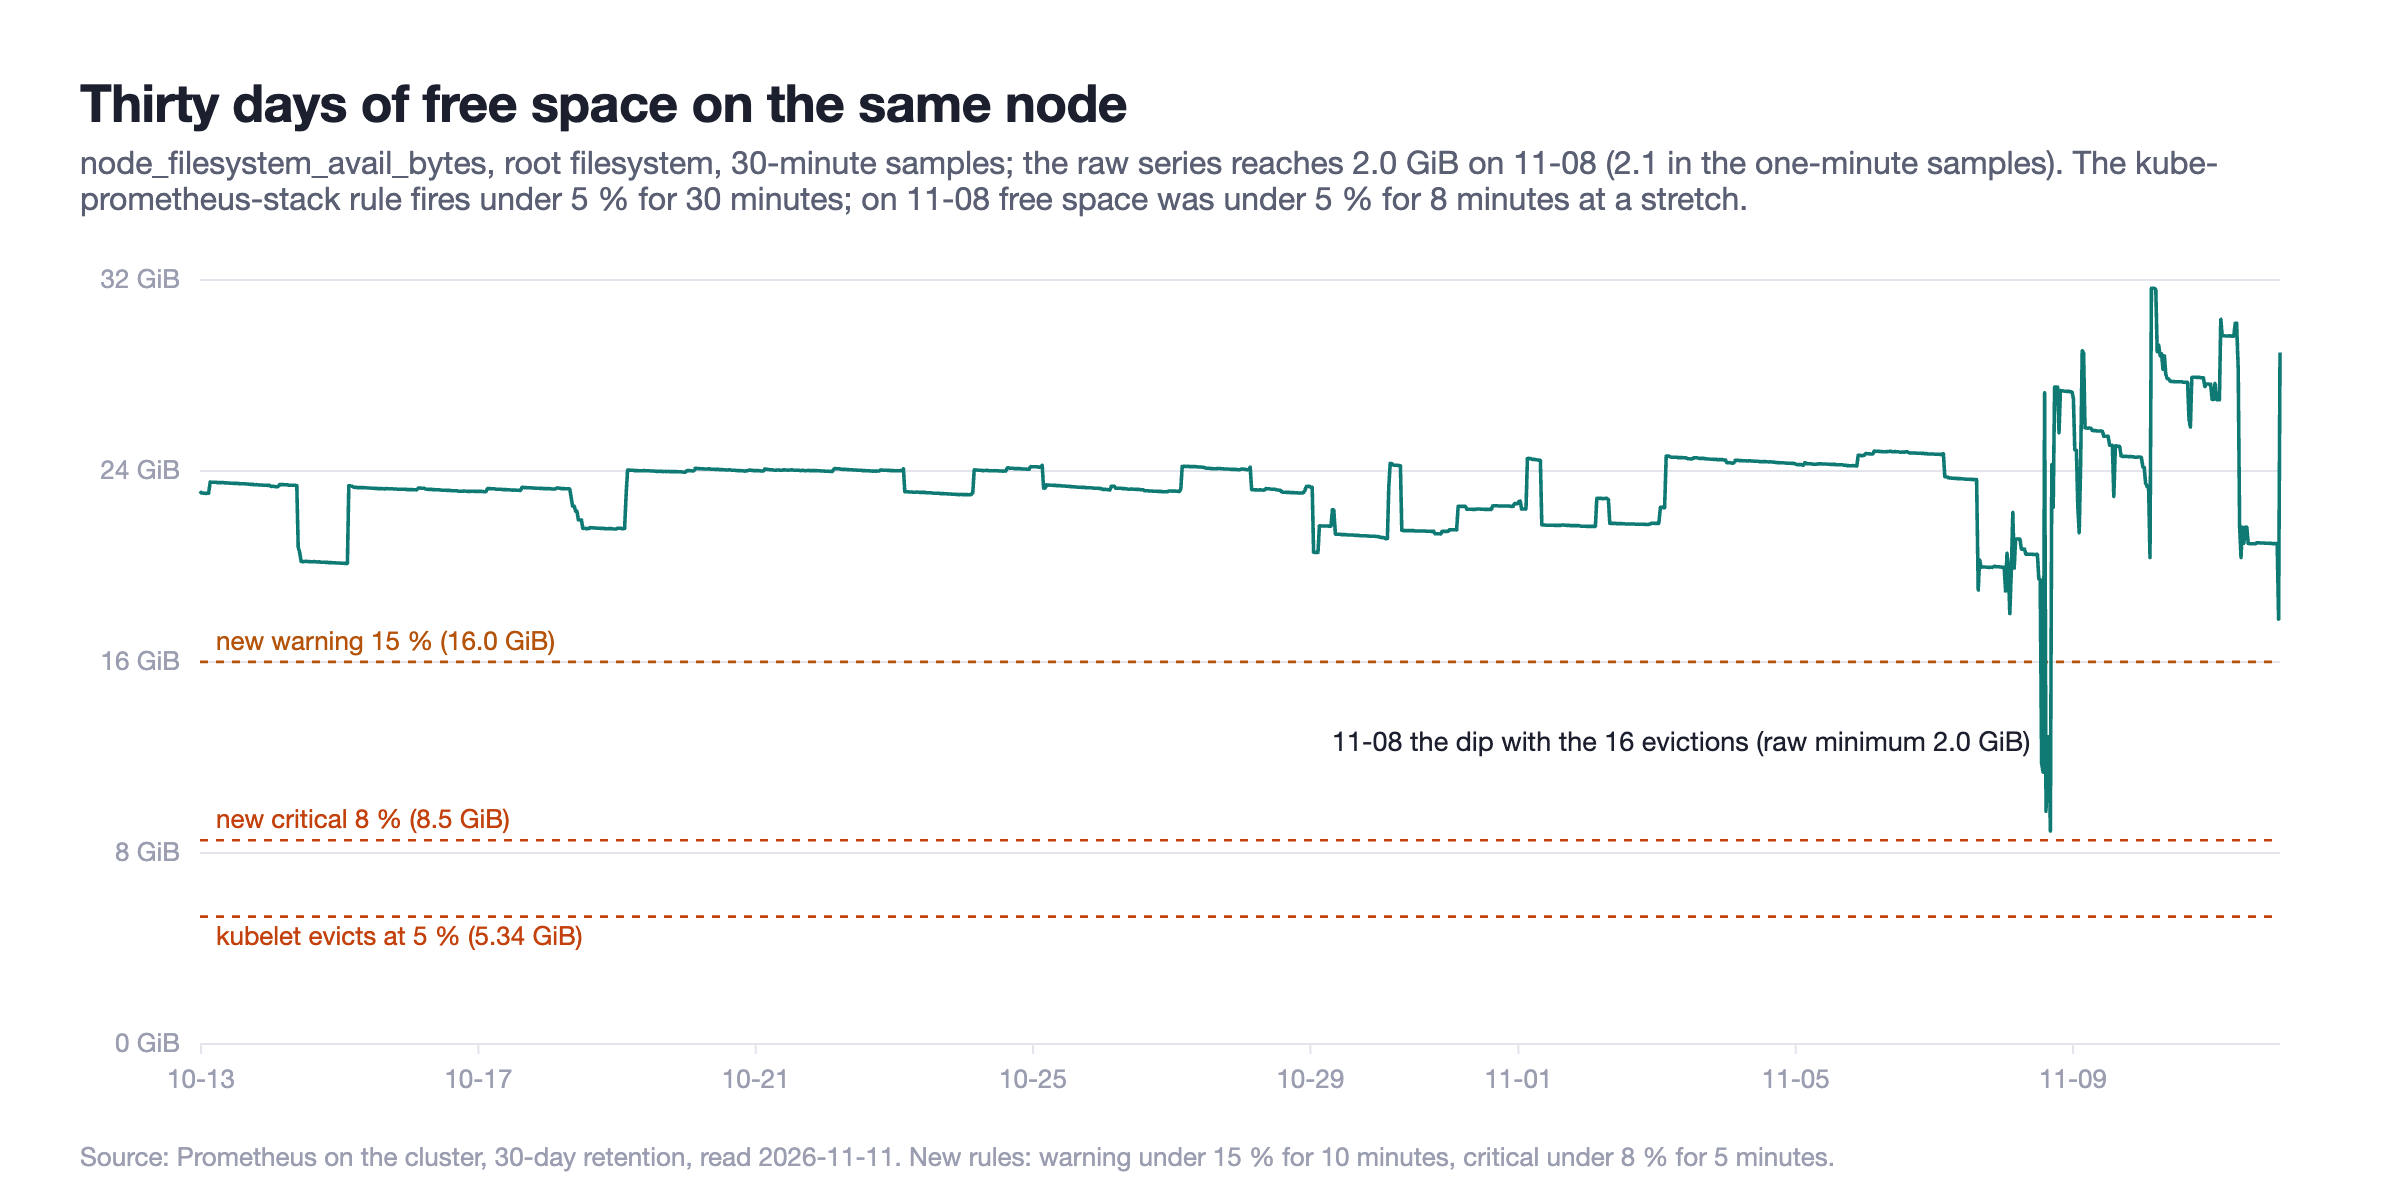
Timeline
| When (UTC) | What |
|---|---|
| 2026-11-08 13:37 | Deployment of a new service updated to a 4.5 GiB image; its pod starts 13:40 (first write-up) |
| 2026-11-08 13:46:24–13:46:51 | Wave 1: five pods evicted, 5.3–6.1 GiB free |
| 2026-11-08 13:47–14:09 | DiskPressure=true; free space 2.6 GiB until 13:55, 14.4 from 13:56, 27.3 at 14:05 (the condition clears about five minutes after free space passed threshold plus minimum reclaim at 14:05) |
| 2026-11-08 14:03:48–14:03:56 | Wave 2: two pods evicted, 14.9–15.2 GiB free |
| 2026-11-08 16:04–16:13 | Two CI runner pods on the node at once |
| 2026-11-08 16:10–16:19 | Second DiskPressure window; 4.5 GiB at 16:10, 2.1 GiB at 16:12–16:13, 27.3 at 16:15 |
| 2026-11-08 16:10:52–16:14:16 | Wave 3: nine pods evicted, 4.3 → 15.4 GiB free |
| 2026-11-10 06:01 | Node rebooted; eviction counters reset |
| 2026-11-11 05:08 | Cluster audit lists the 16 Failed pods and the zero ephemeral-storage requests |
| 2026-11-11 23:45 | ephemeral-storage requests and limits on the runners, requests on the two GPU workloads, two disk alerts, all rolled out |
What I am changing
No disk alert fired that day. The kube-prometheus-stack chart's NodeFilesystemAlmostOutOfSpace rule wants free space under 5 % for 30 minutes; on 11-08 it was under 5 % for eight minutes at the longest stretch and thirteen in the day. The kubelet evicts at 5 % immediately; it had finished before the rule's 30 minutes were up.
Done:
- ephemeral-storage requests and limits on the CI runner and its docker-in-docker sidecar; requests on the two GPU workloads.
- NodeRootDiskLow at 15 % for 10 minutes, NodeRootDiskCritical at 8 % for 5 minutes, the latter on the route that mentions everyone.
Not done yet:
- evictionMinimumReclaim. It lives in the k3s agent configuration on the node, outside git. With the upstream default, no minimum reclaim, the day would have been three evictions: the first pod of wave 1 and the first two of wave 3. At 2–3 % it would have been seven: all five of wave 1, none of wave 2, two of wave 3. It needs a node-level change and a kubelet restart.
- A node for CI. The runners should not share a disk with production at all. That needs hardware I do not have this month.
- Root on the node to break down the 38 GiB that no pod or image accounts for.
- A default ephemeral-storage request through a LimitRange in every production namespace, small enough not to change scheduling, so a new Deployment cannot arrive with zero again; the two cluster components stay outside it.
If your eviction messages show "available" values far above the threshold, read the kubelet's evictionMinimumReclaim first. kubectl get --raw /api/v1/nodes/<node>/proxy/configz | jq .kubeletconfig.evictionMinimumReclaim shows it without logging in to the node.
Public post-incident reports where a node ran out of disk and took unrelated workloads with it are collected under the node disk full and pods evicted symptoms in Incident Library. The audit that surfaced this is kubegap.
Frequently asked questions
Why does the eviction message say the node was low on ephemeral-storage when it shows 15 GiB available?
The kubelet reports the value it observed when it chose that pod, and it keeps evicting after the threshold is cleared until the signal is above threshold plus evictionMinimumReclaim. On a 106.7 GiB filesystem with a 5 % threshold and a 10 % minimum reclaim that is 16.0 GiB, so a message with 15 GiB available is consistent with the configuration.
How do I read my node's eviction settings without logging in?
kubectl get --raw /api/v1/nodes/<node>/proxy/configz | jq .kubeletconfig returns the running kubelet configuration, including evictionHard, evictionSoft, evictionMinimumReclaim, imageGCHighThresholdPercent and imageGCLowThresholdPercent. k3s defaults to 5 % hard thresholds and a 10 % minimum reclaim for nodefs and imagefs; upstream Kubernetes leaves minimum reclaim empty.
How does the kubelet choose which pod to evict under disk pressure?
Pods the kubelet has no stats for come first. Then pods whose ephemeral-storage usage exceeds their request, then by priority, then by how far usage exceeds the request. If nothing requests ephemeral-storage, every pod that holds anything on disk is in the exceeding group and the tie-break is priority, then raw usage. A pod with a request it stays under sorts after all of them.
What should a CI runner with docker-in-docker request?
An ephemeral-storage request and limit on both the runner container and the dind container (for example 2Gi/10Gi and 5Gi/20Gi), so the scheduler accounts for build storage and the kubelet evicts the runner, not production pods, when a build fills the disk. Better still, a node the runners do not share with production.