What it checks
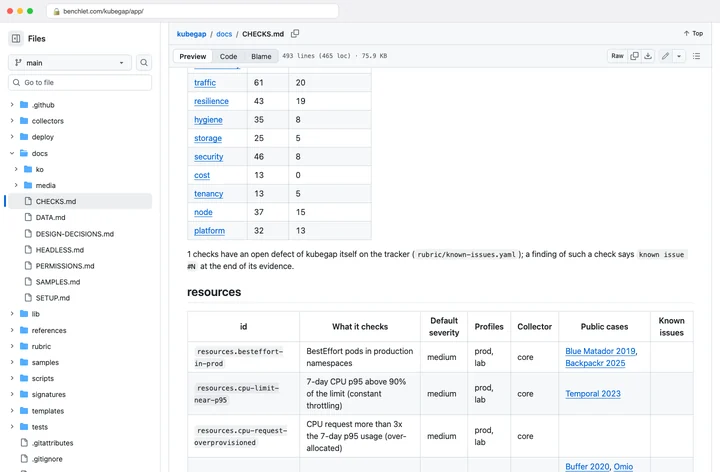
There are 411 checks in 12 areas, and each check is one condition that counts as a problem. Resources covers requests far above measured usage, repeated OOMKills and nodes full of requests at single-digit utilization. Scaling covers HPAs stuck at their limits, Karpenter nodes past their expiry and KEDA triggers without a fallback. Observability, the largest area with 64 checks, covers missing symptom-based alerts, alerts that have fired for a week, a monitoring stack on emptyDir and ingress metrics that nobody scrapes. Traffic covers database ports open to the internet, unhealthy load balancer targets and deregistration delays longer than the termination grace period.
Resilience covers replicas packed onto one node, missing PodDisruptionBudgets, backup dumps on the same disk as the data and workloads that can run on only one node. Hygiene covers latest tags, deprecated APIs and Helm releases stuck in pending. Storage covers unencrypted volumes and StorageClasses with expansion turned off. Security covers NetworkPolicies that are not enforced, IMDSv1, plaintext secrets in environment variables and wildcard RBAC. Cost, multi-tenancy, the node operating system and the platform itself, from Kubernetes end of support to outdated add-ons and slow k3s etcd, make up the rest.
Checks for a component such as Karpenter, Argo CD or cert-manager run only when that component is installed. What is expected depends on the kind and size of the cluster: EKS is held to the production baseline, while k3s, RKE2 and clusters of three nodes or fewer get a small-cluster baseline that still expects backups, SLOs and an alert router but not multi-zone spread. Scripts judge 409 of the 411 checks, so the same data gives the same result; the agent judges the other two and then decides what is most urgent.
What the report looks like
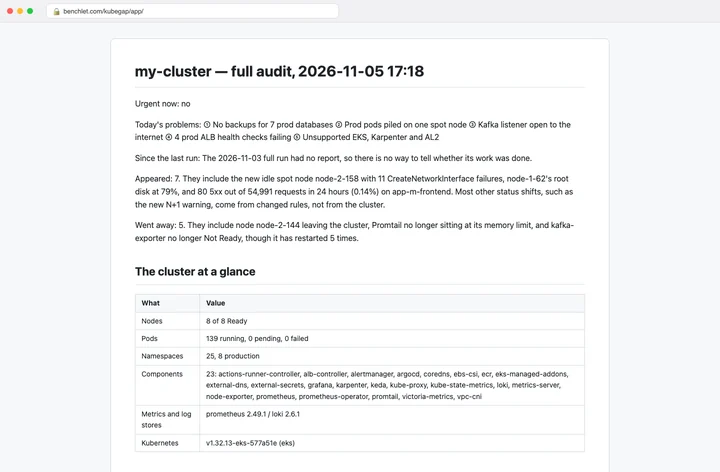
A report opens with one screen: whether anything is broken right now, today's problems, and whether what the previous report asked for was done. Then come the cluster at a glance, with nodes, pods, namespaces, components and stores, and what is coming up, such as node and certificate expiries, end of support dates and cleanup jobs. Both of those are written by code from the snapshot, not by the model.
Each problem has six parts: what is happening and who is affected, only what was actually looked at; why; a suggested fix; how to roll it back; why this happens, with the principle behind it, a public case and official documents or books to read next; and the evidence with the files it came from. Each step of a fix says what the cluster does when you run it, what restarts or goes down, and how to see that it worked. The sample full audit of an EKS cluster opens with seven production databases that had no backup, and continues with production pods piled on one spot node, a Kafka listener open to the internet, four failing ALB health checks and an EKS version past standard support.
After the problems come a table of what the previous report asked for and whether it was done, every other critical or high item in one line, and, in a full audit, one line per area. A closing section lists what the run could not see and why, such as nodes without SSM registration or Grafana without a read token, and never counts what it could not see as a pass. There is no score. The report gives counts by severity and the change since the previous run.
How it reaches your cluster and what happens to your data
kubegap only reads the cluster. It reads pods, Deployments, events, logs and metrics through the Kubernetes API with the kubeconfig, AWS CLI profile and SSH setup you already use, and it creates, changes and deletes nothing. It reaches Prometheus, Alertmanager, Loki and Grafana through a port-forward, which leaves nothing behind in the cluster either. A ClusterRole and an IAM policy for a security review are in the repository, and a test keeps them in step with what the code actually calls.
Secret values are never collected; kubegap sees only their names and types. ConfigMap values are not stored either, apart from the few configuration keys it has to parse, such as the CoreDNS Corefile. Component pod logs are read by a script that counts them by error type, keeps masked samples and deletes the originals before the agent starts. Everything collected is written to a folder under ~/.kubegap/ on your machine, about 40 MB for a full audit, and kubegap itself sends nothing anywhere.
What does leave your machine is what the agent reads from that snapshot to write the report: the summary, the first-pass findings and the raw files it opens to check a number. That goes to the model API of the agent you run, Anthropic's for Claude Code or OpenAI's for Codex. There is no mode that keeps the data local, because the report is written by the model. The repository's DATA.md says exactly what is collected, kept and sent, and PERMISSIONS.md lists every permission and what you lose without it.
Which clusters it works on
kubegap runs on any cluster kubectl can read, and how deep it can see depends on the kind of cluster. On EKS it sees inside the cluster, inside the nodes through AWS Systems Manager, and on the AWS side the control-plane logs, node groups, add-ons, spot and cost. On k3s it sees inside the cluster, inside the nodes over SSH, and the k3s logs, etcd and datastore. On GKE, AKS, kubeadm and others it sees inside the cluster and, where SSH is set up, inside the nodes; their cloud side is not read yet.
The facts kubegap relies on, such as metric names, log messages and API fields, were read in the source code of each component at specific versions and cited in a sources table of more than 1,500 rows. The README lists the version range read for each of about 40 components, from Kubernetes v1.30 to v1.37 and CoreDNS v1.10 to v1.15 to Karpenter v0.37 to v1.15. Outside a range kubegap still runs and the report header says so.
Install and the first run
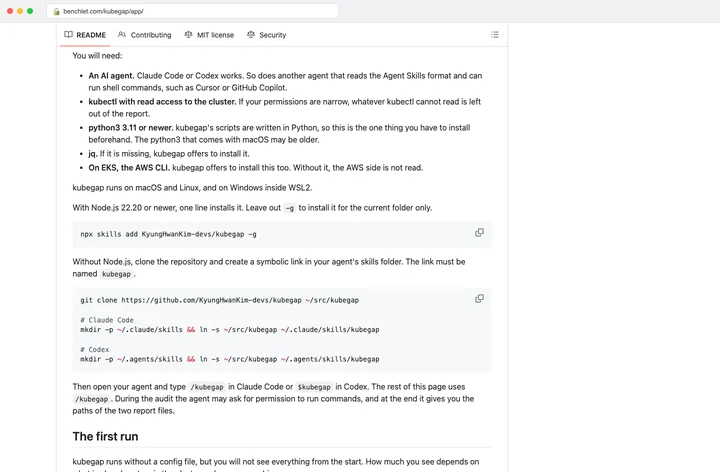
You need an AI agent that reads the Agent Skills format and can run shell commands, such as Claude Code or Codex, kubectl with read access to the cluster, python3 3.11 or newer, and jq. On EKS you also need the AWS CLI. kubegap runs on macOS and Linux, and on Windows inside WSL2. With Node.js 22.20 or newer one line installs it: npx skills add KyungHwanKim-devs/kubegap -g. Without Node.js, clone the repository and create a symbolic link named kubegap in your agent's skills folder.
The first run starts with two questions, the report language, English or Korean, and whether to audit the cluster kubectl currently points at. With nothing else configured, kubegap reads objects, events and the logs and metrics of component pods, finds Prometheus, Alertmanager, Loki and Grafana if they have a Service in the cluster, and on EKS reads the AWS side with your profile. To see more, it asks about four things only when they are not yet set up: extra tools such as krr, pluto and polaris, access to the inside of the nodes, a read-only Grafana token, and the addresses of monitoring tools that run outside the cluster. Every one can be skipped, and until you choose, kubegap installs nothing, uploads nothing and connects to no node.
The same skill runs without a person, with claude -p or codex exec, once the language and the context are in the config file, and the repository's HEADLESS.md shows a crontab for a daily audit on weekdays and a full audit on Sunday night. kubegap never creates the schedule itself; you write it.
Related: the public reports behind the checks
The 113 checks that carry a public case point to 209 published incident write-ups and postmortems in all, from Airbnb, Buffer, Zalando, Moonlight, InfluxData, ZenML and many others. A case is attached to a check only when the write-up's root cause is the condition the check detects, and the report cites only those. Checks without one are configuration rules, and the report says there is no public case rather than inventing one.
Those same reports are searchable by symptom at Incident Library, https://benchlet.com/incidentlib/app, where each one is written up as a structured case with the symptoms the engineers saw, the trigger, the root cause, the remediation and a link to the original. Incident Library also has a public API at https://incidentlib-api.benchlet.com and an MCP server at https://incidentlib-mcp.benchlet.com/mcp, so an AI assistant can look up the cases behind a kubegap finding directly.